Mindful Mondays: Let’s Talk About It!

Mindful Mondays: Let’s Talk About It!

The Fort Collins Museum of Discovery (FCMoD) is honored to bring the groundbreaking traveling exhibition Mental Health: Mind Matters to our community from October 3, 2020- January 10, 2021. With the generous support of our community partners this exhibit and the museum are free during the run of this exhibit 

In the fall of 2018, FCMoD secured this exhibit knowing that mental health would be a timely topic for our community. And while this topic was important two years ago, the need for us as individuals, neighbors, parents, children, community members and community leaders to engage in conversation about mental health and mental illness has only grown.

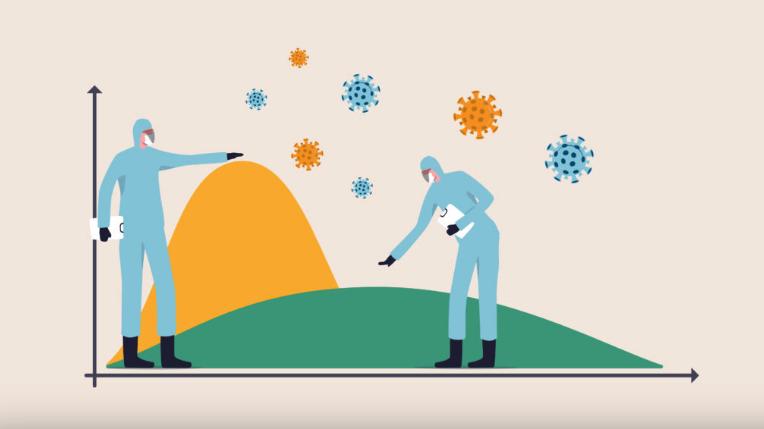
Between the COVID-19 public health crisis, economic recession, wildfires, and unrest around racial justice, the year 2020 has given us all our share of challenges. Although uncertainty and difficulties still walk with us through this time, so do the threads of hope and greater resiliencyThis year, we found new ways to connect with one another, had opportunities to challenge assumptions and reframe narratives, and refocused areas in our lives that we find to be most important. This exhibit provides yet another opportunity to step into a conversation that touches all of our lives, in an environment that is safe, welcoming and hopeful. 
 

Mental Health: Mind Matters is an interactivetrilingual exhibit that provides experiences for visitors of all ages to help open the door for greater understanding, conversations and empathy toward the challenges of mental health. Walking through the exhibit you will have the opportunity to engage with empathy-building experience like hearing from people – in their own words – about how mental illness affects their lives. Interactives like noise-distorting headphones help visitors experience the difficulties some people have with symptoms of psychosis. Another interactive lets you dance around to learn about the connection between physical activity and mental wellnessTest your knowledge with a multi-player quiz about common misperceptions around mental illnesses and mental health. Anchored toward the back of the exhibit, you can check out a resource area that includes both children and adult activities, books and other helpful resources on mental health. Don’t forget to visit the Worry Shredder to shred your worries away! These are just some of the many incredible experiences in this remarkable exhibit. 
 

Working with our community partners, FCMoD will feature virtual and in-person programming throughout the dates of this exhibit. Forest therapy walks encourage participants to relax in nature. FCMoD’s virtual lecture series, Discovery Live, offers opportunities to hear from the mental health experts in our community and learn about the amazing work their organizations are doing. Programming in the museum’s gallery demonstrates different mindfulness techniques and relaxation activities. Visit fcmod.org to find the programs that resonate with you and learn how to take this conversation to the next level. 

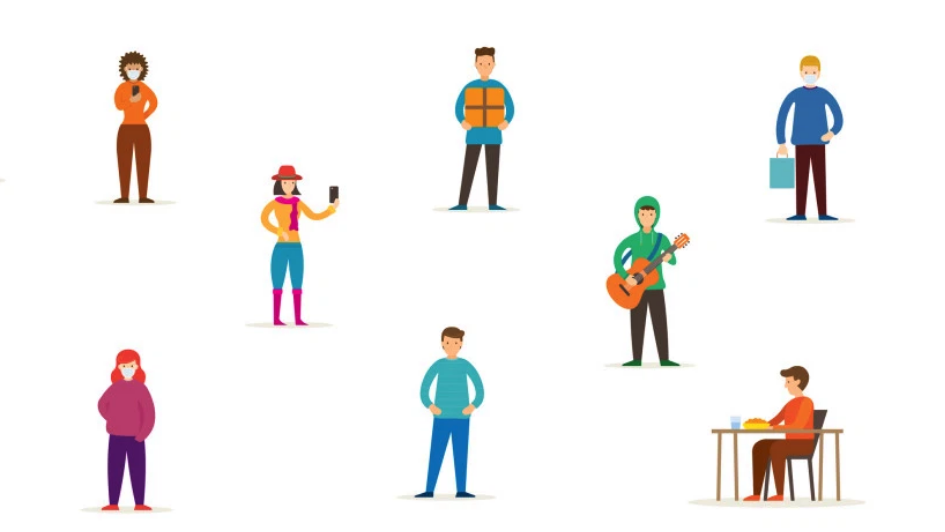
As you consider visiting FCMoD, we want you to know about our deep commitment to keeping you safe during your visit. Gallery hosts regularly clean the museum throughout the day, with special attention to high-touch areas. All visitors over the age of two to are required to wear a face covering, and contact information will be requested at the beginning of the visit to help with contact tracingAlthough the museum is free through January 10, ticket reservations are required to help manage capacity and appropriate physical distancing. Groups 15 should contact the museum to reserve blocks of tickets. Ticketing information is available on the Plan Your Visit webpage. 


To stay informed on the latest Mental Health: Mind Matters programs and experiences, visit the Mind Matters webpage and follow us on Facebook, Instagram, Twitter. Don’t forget to tag us in your experiences when you visit the museum to help us #MakeItOk. 

We look forward to welcoming you to FCMoD to experience this amazing exhibit!  

Continue Reading

Daily Discovery: Drawing Music/ Descubrimiento en casa: “Dibujando” música

Post written by Eisen Tamkun, Music Programming Lead.

Daily Discovery: Drawing Music

Music has the power to influence our emotions. Have you ever gotten a chill or thrill while listening to your favorite music? Listening to music is an easy way to alter your mood or relieve stress. Gain a deeper understanding of how music influences us by drawing!

Supplies:

  • Drawing Paper
  • Favorite drawing utensils: pens, pencils, paint, etc.
  • Listening device: iPhone, Computer, etc.

Instructions:

1. Take your paper and divide it into four sections. Label each section 1-4 in the top right corner.
2. Once you are ready to start drawing in section 1, begin playing Blowin’ in the Wind by Bob Dylan. Be sure there are no noises besides the song (works best with headphones). Continue drawing until the song is completely over. Listen and let the song guide your drawing. It can be shapes, images, or anything in between. If need be play through the song a second time (or more if you want!)
3. Move to section 2 on your paper and play Für Elise by Beethoven. Repeat Step 2 and listen to the whole song through letting it guide your drawing!
4. For section 3 listen to Walking on Sunshine by Katrina and the Waves. Repeat Step 2.
5. Lastly, for section 4 play Take Me Home, Country Roads by John D. Repeat Step 2.

Now see if one of your family members can guess which one of your drawings match each song!

Want to download these directions? Click here for a handy PDF!

Follow along with our Daily Discovery! Click here for all activities that you can do at home.

Educational opportunities like this are supported in part by Bohemian.

Traducido por Károl de Rueda y Laura Vilaret-Tuma.

Descubrimiento en casa: “Dibujando” música

La música tiene el poder de influir en nuestras emociones. ¿Haz sentido alguna sensación de alegría o emoción mientras escuchas tu música favorita? Esta puede cambiarnos el humor y aliviar el estrés. Aprendamos cómo la música nos puede inspirar ¡mientras dibujamos!

Artículos necesarios:

  •  Hojas de papel
  • Utensilios para dibujar: plumas, lápices de color, pinturas, marcadores, etc.
  • Algún aparato para poder escuchar música: teléfono, computadora, radio, etc.
  • Opcional: audífonos

Instrucciones:

  1. Divide un papel en cuatro secciones. Numera del 1 al 4 la esquina superior derecha de cada sección.
  2.  Comienza a escuchar tu canción favorita, asegurándote de que no haya ningún otro ruido a tu alrededor (esta actividad funciona mejor con audífonos), y utilizando la sección número 1 del papel, comienza a dibujar lo que quieras mientras la escuchas. Deja que la música te guíe. Puedes trazar figuras, imágenes o cualquier cosa que sientas. Escucha la canción las veces que quieras mientras continúas expresándote por medio de lo que dibujas.
  3. Para el papel número 2, pon otra canción. Repite lo que hiciste anteriormente y escucha la canción entera mientras esta te guía para crear arte.
  4. Para los papeles números 3 y 4, escucha otras canciones que te gusten.
  5. Estas son algunas recomendaciones de nuestras canciones favoritas:
    • Foo Foo por Santana
    • Octopus’s Garden por The Beatles
    • Etude Op. 25 No. 11 (Winter Wind) por Chopin
    Tu rumba por iLe
    • Tu canción preferida.
    Para terminar, podrías ver si alguno de tus familiares puede adivinar las canciones que representan tus dibujos.

¿Te gustaría descargar esta actividad? Haz clic aquí para obtener un archivo PDF.

Para encontrar actividades, ideas y mucho más descubrimiento en casa, ¡síguenos!

Educational opportunities like this are supported in part by Bohemian.

Continue Reading

At Home Workout Resources

Post written by Alex Ballou, Marketing Assistant.

At Home Workout Resources

Here at FCMoD, we believe in the importance of working your mind and your body. And during times like this, we want to provide resources to continue exploring together.

In this blog post, we’ve compiled a list of our recommended at home workout resources during this time. Learn more below!

  • Here are some fun ways to get active as a family!
  • Let’s get the whole family moving – together! Here are 10 ways to exercise as a family.
  • Have a backyard? Here are some outdoor activities to get the family working out with no-equipment necessary!
  • Trying to stay in shape while working at home with the kids? Here are some fun at-home workouts that everyone will enjoy!

Even though the museum is closed, we want to continue to inspire creativity and encourage hands-on learning for all!

Image Credit: WellnessMama.com

Continue Reading

Daily Discovery: Social Distancing – How Long Is Six Feet?

Post written by Angela Kettle, School Programs Coordinator.

Daily Discovery: Social Distancing – How Long Is Six Feet?

We have an important job to do together – and that job is staying apart! As COVID-19 spreads, the Center for Disease Control and Prevention urges people to stay at least six feet away from those who live outside of our homes whenever possible.

What does six feet actually mean, though? Go on an adventure inside your home to see what objects (stacked together or on their own) are at least six feet long! Then, use these objects to help you picture what six feet means when you are out in public.

Supplies:

  • Measuring tape (if you don’t have one, you can print a template at the end of this document, or you can download an app like Measure from Google on a smartphone or tablet)
  • Pencil and paper to record measurements
  • Camera (optional)

Instructions:

  1. Write down six things on your paper that you would like to measure. These should be things that are already in your house. These things can be big, or small! (At the bottom of this, you can see some of the things one of our FCMoD educators measured at her house!)
  2. Get out your measuring tape, and release six feet of tape. Observe what that distance looks like on the measuring tape.
  3. Make a prediction about how long you think each of the household objects that you wrote down will be: shorter than 6 feet, 6 feet, or longer than 6 feet.
  4. Time to measure! Make sure to be safe – if you are not tall enough to reach something, ask someone taller than you to help. Write down each measurement in inches as you go.
  5. Now look at your results! Six feet is the same as 72 inches. Were your items longer than, shorter than, or equal to six feet?
  6. Math Bonus: See how many of the item you would need to make six feet!a.
    • If your object was shorter than 72 inches, divide 72 inches by the length of your object in inches. For example, since our educator’s cat was 27 inches, she would divide 72 inches by 27 inches to get 2.6 cats. So, she would need to put 2-and-a-half of her cats (stretched out!) between her and another person to practice proper social distancing.
    • If your object was longer than 72 inches, you will still divide 72 by the length of your object. However, you should get an answer that is less than 1 (a decimal). For example, our educator’s closet door was 78 inches. If you divide 72 inches by 78 inches, you get .92. So, she would need almost her entire closet door’s length – 92% of it – between her and another person to practice proper social distancing.
    •  Now, any time you have to be out in public, picture one of your items that was close to six feet long. In your imagination, place that object between you and any people around you. Share your objects with us on social media with the hashtag #DailyDiscovery to help others picture six feet, too!

Want to download these directions? Click here for a handy PDF!

Follow along with our Daily Discovery! Click here for all activities that you can do at home.

Image credit: CalMatters.org

Continue Reading

Daily Discovery: What Does it Mean to “Flatten the Curve?”

Post written by Angela Kettle, School Programs Coordinator.

Daily Discovery: Slowing the Spread – What Does it Mean to “Flatten the Curve?”

Note for Caregivers: This activity is meant to help older children (and adults!) better understand how quickly diseases like COVID-19 can spread. Most importantly, though, it is meant to start a conversation about what we can do to slow the spread through social distancing and healthy habits. Recommendations by the Center for Disease Control and Prevention state that giving  children factual, age-appropriate information, along with providing action steps they can take, can help children cope with stressful information. Therefore, we recommend this activity for ages 10+, with the guidance and reassurance of a caregiver, though we encourage you to use your discretion. You know your child best! More tips on talking with children about COVID-19 are available here!

Mathematicians use statistical models to make predictions about the future. These predictions help people like you and me make decisions about how we should behave, and they also help policy makers create policies that are in the best interest of the public.

Right now, many mathematicians are making statistical models to predict the spread of COVID-19, or coronavirus. These models help us predict how human behavior will affect the spread of the virus. Let’s make our own model to see how it works! (Bonus: you get to tear up paper into tiny pieces!)

Definitions to Know:

  • Statistical Model: An equation used to predict what could happen under a certain set of circumstances. Statistical models range from quite simple to very complex.
  • COVID-19: According to the World Health Organization, “COVID-19 is the infectious disease caused by the most recently discovered coronavirus. This new virus and disease were unknown before the outbreak began in Wuhan, China, in December 2019.”
  • Social Distancing: Social distancing is intentionally increasing the physical space between people to avoid spreading illness (most sources recommend 6 feet minimum between people). Examples include staying away from large gatherings of people, canceling school, and encouraging employees to work
    from home.
  • Rate of Reproduction: Often seen as R0 and pronounced “R-nought,” this figure helps scientists explain how intense an outbreak is. It predicts how many other people will catch the virus from one infected person.
  • Infectious Period: The time during which an infected person can spread the disease to others. This is often different than the total time a person feels sick.  Sometimes, the infectious period begins before a person starts showing symptoms whatsoever. The infectious period differs for each disease.
  • Disease: Illness or sickness characterized by specific signs and symptoms.
  • Virus: A microorganism that cannot grow or reproduce apart from a living cell. Viruses cause human infections, and infections often result in disease.

Supplies:

  • 1 piece of paper for experiment (we recommend scratch paper if you have it)
  • 1 piece of paper for graph
  • Pen or pencil
  • A calculator
  • A straight-edge (optional)

Instructions:

  1. We are going to make a model for the spread of an imaginary disease. Technical note: Scientists usually call the disease caused by a virus something different than the virus itself. For example, the name of the virus that causes the disease COVID-19 is actually SARS-CoV-2. Let’s call our imaginary virus IMAGINATION-1, and the disease caused by the virus  IMAGINE-1. We’ll say that with no social distancing measures in place, IMAGINATION-1 has a Rate of Reproduction (abbreviated R0) of 2 – meaning that every person who catches the virus will spread it to 2 other people during their infectious period. We’ll also say that the infectious period for IMAGINATION-1 is 24 hours, or 1 day.
  2. We are going to make a graph to chart how many new cases of IMAGINE-1 (the disease) there are each day. Draw a graph by making a large L-shape on a piece of paper (use a straight edge if desired). Title your graph so that others know what it represents (a good title might be “New Cases of IMAGINE-1 per Day”). Label the x-axis (the line going sideways) with your unit of measurement – in this case, Time in Days. Place 7 tick marks along this line. Label these tick marks from Day 1 to Day 7. Label the y-axis (the line going up and down) with your unit of measurement – in this case, Cases of IMAGINE-1. Place 20 tick marks. Label each tick mark, counting up from 5 (5, 10, 15, etc.).
  3. Let’s say that 1 person caught the first-ever case of IMAGINE-1. Find Day 1 on your x-axis. Find the value 1 on your y-axis (just barely up from the bottom of your graph). Place a dot where the x-axis and y-axis meet. This shows that on Day 1, there is 1 new case of IMAGINE-1.
  4. Now, we’ll move on to Day 2. Based on our R0 of 2, the first infected person would spread the disease to 2 other people during their infectious period. Now it’s time to tear up some paper! Get out your blank sheet of paper. Tear your sheet in half, representing that 2 new people now have the disease. Find Day 2 on your X-Axis, find where the value 2 falls on your Y-Axis, and plot this on your graph with a dot.
  5. Tear your 2 pieces of paper in half again. How many pieces of paper do you have now? Plot this number above Day 3.
  6. Repeat tearing your pieces and plotting your points for Days 4, 5, 6, and 7 (Note: Want to check if you’re on track? Look at the end of this document for the number of new cases each day.) Draw a line to connect one point to the next point.
  7. Now it’s time to get out your calculator! Multiply Day 7’s result by 2 to get your new number of cases on Day 8. Multiply that number by 2 to find your new cases on Day 9. Continue this process. How many new cases do you have on Day 15?
  8. This model just showed us how many new cases there were on each day — not the total number of cases over the whole 15 days. Find the total number of cases by adding together all the new cases for each day.
  9. Save your little pieces of paper for other crafts and activities!

Want to download these directions? Click here for a handy PDF!

Follow along with our Daily Discovery! Click here for all activities that you can do at home.

Image credit: MilwaukeeMag.com

Continue Reading