Post written by Angela Kettle, School Programs Coordinator.
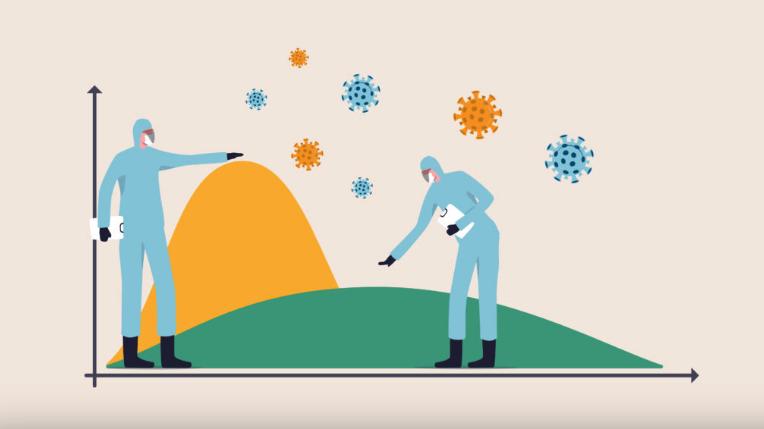
Daily Discovery: Slowing the Spread – What Does it Mean to “Flatten the Curve?”
Note for Caregivers: This activity is meant to help older children (and adults!) better understand how quickly diseases like COVID-19 can spread. Most importantly, though, it is meant to start a conversation about what we can do to slow the spread through social distancing and healthy habits. Recommendations by the Center for Disease Control and Prevention state that giving children factual, age-appropriate information, along with providing action steps they can take, can help children cope with stressful information. Therefore, we recommend this activity for ages 10+, with the guidance and reassurance of a caregiver, though we encourage you to use your discretion. You know your child best! More tips on talking with children about COVID-19 are available here!
Mathematicians use statistical models to make predictions about the future. These predictions help people like you and me make decisions about how we should behave, and they also help policy makers create policies that are in the best interest of the public.
Right now, many mathematicians are making statistical models to predict the spread of COVID-19, or coronavirus. These models help us predict how human behavior will affect the spread of the virus. Let’s make our own model to see how it works! (Bonus: you get to tear up paper into tiny pieces!)
Definitions to Know:
- Statistical Model: An equation used to predict what could happen under a certain set of circumstances. Statistical models range from quite simple to very complex.
- COVID-19: According to the World Health Organization, “COVID-19 is the infectious disease caused by the most recently discovered coronavirus. This new virus and disease were unknown before the outbreak began in Wuhan, China, in December 2019.”
- Social Distancing: Social distancing is intentionally increasing the physical space between people to avoid spreading illness (most sources recommend 6 feet minimum between people). Examples include staying away from large gatherings of people, canceling school, and encouraging employees to work
from home. - Rate of Reproduction: Often seen as R0 and pronounced “R-nought,” this figure helps scientists explain how intense an outbreak is. It predicts how many other people will catch the virus from one infected person.
- Infectious Period: The time during which an infected person can spread the disease to others. This is often different than the total time a person feels sick. Sometimes, the infectious period begins before a person starts showing symptoms whatsoever. The infectious period differs for each disease.
- Disease: Illness or sickness characterized by specific signs and symptoms.
- Virus: A microorganism that cannot grow or reproduce apart from a living cell. Viruses cause human infections, and infections often result in disease.
Supplies:
- 1 piece of paper for experiment (we recommend scratch paper if you have it)
- 1 piece of paper for graph
- Pen or pencil
- A calculator
- A straight-edge (optional)
Instructions:
- We are going to make a model for the spread of an imaginary disease. Technical note: Scientists usually call the disease caused by a virus something different than the virus itself. For example, the name of the virus that causes the disease COVID-19 is actually SARS-CoV-2. Let’s call our imaginary virus IMAGINATION-1, and the disease caused by the virus IMAGINE-1. We’ll say that with no social distancing measures in place, IMAGINATION-1 has a Rate of Reproduction (abbreviated R0) of 2 – meaning that every person who catches the virus will spread it to 2 other people during their infectious period. We’ll also say that the infectious period for IMAGINATION-1 is 24 hours, or 1 day.
- We are going to make a graph to chart how many new cases of IMAGINE-1 (the disease) there are each day. Draw a graph by making a large L-shape on a piece of paper (use a straight edge if desired). Title your graph so that others know what it represents (a good title might be “New Cases of IMAGINE-1 per Day”). Label the x-axis (the line going sideways) with your unit of measurement – in this case, Time in Days. Place 7 tick marks along this line. Label these tick marks from Day 1 to Day 7. Label the y-axis (the line going up and down) with your unit of measurement – in this case, Cases of IMAGINE-1. Place 20 tick marks. Label each tick mark, counting up from 5 (5, 10, 15, etc.).
- Let’s say that 1 person caught the first-ever case of IMAGINE-1. Find Day 1 on your x-axis. Find the value 1 on your y-axis (just barely up from the bottom of your graph). Place a dot where the x-axis and y-axis meet. This shows that on Day 1, there is 1 new case of IMAGINE-1.
- Now, we’ll move on to Day 2. Based on our R0 of 2, the first infected person would spread the disease to 2 other people during their infectious period. Now it’s time to tear up some paper! Get out your blank sheet of paper. Tear your sheet in half, representing that 2 new people now have the disease. Find Day 2 on your X-Axis, find where the value 2 falls on your Y-Axis, and plot this on your graph with a dot.
- Tear your 2 pieces of paper in half again. How many pieces of paper do you have now? Plot this number above Day 3.
- Repeat tearing your pieces and plotting your points for Days 4, 5, 6, and 7 (Note: Want to check if you’re on track? Look at the end of this document for the number of new cases each day.) Draw a line to connect one point to the next point.
- Now it’s time to get out your calculator! Multiply Day 7’s result by 2 to get your new number of cases on Day 8. Multiply that number by 2 to find your new cases on Day 9. Continue this process. How many new cases do you have on Day 15?
- This model just showed us how many new cases there were on each day — not the total number of cases over the whole 15 days. Find the total number of cases by adding together all the new cases for each day.
- Save your little pieces of paper for other crafts and activities!
Want to download these directions? Click here for a handy PDF!
Follow along with our Daily Discovery! Click here for all activities that you can do at home.
Image credit: MilwaukeeMag.com